OKLO: The Next Nuclear Power Play for the AI Era📋 OKLO (Oklo Inc.)
Price: ~$49 (after a +16% post-earnings rally) | August 7, 2026
Oklo is no longer just another nuclear startup waiting for regulatory approval. It has become the only private company in the United States to bring a privately built nuclear reactor from a greenfield site to criticality in less than a year. Shares surged 14–16% today after the company reported its first quarter with real revenue and announced that the Groves reactor had successfully reached criticality.
The market is beginning to see a transition from a story driven by expectations to one backed by execution. The key question now is whether that narrative can justify an ~$8 billion valuation while the company is still losing money.
🏛️ Fundamental Analysis
🏢 Business Overview
Oklo is developing compact fast-neutron nuclear reactors under the Aurora platform, ranging from 15 MW to 75 MW, designed to power AI data centers, military installations, and industrial facilities.
Unlike many competitors, including NuScale, Oklo does not intend to simply license its reactor technology. Instead, the company plans to build, own, and operate its reactors while selling electricity directly to customers through long-term Power Purchase Agreements (PPAs), creating a recurring revenue model.
Beyond electricity generation, Oklo is also expanding into two complementary businesses:
Nuclear fuel recycling, converting spent nuclear fuel into HALEU fuel.
Medical and industrial isotope production through the Groves reactor.
OpenAI co-founder Sam Altman served as Chairman until last year, and his association continues to strengthen the company's visibility within the AI and technology ecosystem.
💰 Financial Position
Until Q2 2026, Oklo generated virtually no operating revenue.
That changed this quarter.
The company reported $1.2 million in revenue, its first meaningful revenue in history, primarily driven by recently acquired businesses.
Financial results remain deeply negative:
Net loss (first half of 2026): $81.6 million
Operating loss: $124.2 million
These losses were partially offset by $44.5 million of interest and investment income generated from the company's exceptionally large cash position.
Cash Position
Liquidity remains Oklo's greatest strength.
At the end of Q2 2026, the company held approximately $3 billion in cash and marketable securities.
However, spending is accelerating.
Management increased 2026 guidance to:
Operating cash outflow: $120–150 million
Capital expenditures: $400–500 million
Total expected cash usage therefore approaches $550–650 million annually, implying roughly 4–5 years of runway at the current pace.
The larger concern is shareholder dilution.
During 2026 alone, Oklo raised approximately $1.9 billion through its ATM equity program, significantly increasing the share count.
Traditional valuation metrics such as P/E or EV/EBITDA are not applicable.
Today's valuation depends almost entirely on whether Aurora-INL begins commercial operations in 2028 and whether management can successfully scale the business afterward.
📰 Recent Developments
August 7 marked one of Oklo's strongest trading days in years—and for good reason.
Groves Reactor Reaches Criticality
On August 5, the Groves Isotope Test Reactor in Texas achieved first criticality.
Management described it as:
"The fastest transition from a greenfield site to criticality for a full-scale privately owned reactor on private land in U.S. history."
Construction to operation took less than 11 months, making it a genuine engineering milestone rather than another announcement of future plans.
Aurora-INL Progress
The U.S. Department of Energy approved another safety review for Aurora-INL, completing the second of five major regulatory milestones.
Commercial operation remains targeted for 2028.
Customer Pipeline
Demand continues to build.
Recent announcements include:
Meta — agreement to supply approximately 1.2 GW of electricity for an Ohio AI data center campus by 2030.
Switch — previously announced 20-year framework agreement covering up to 12 GW of potential capacity.
Preliminary selection to provide power for Eielson Air Force Base in Alaska.
An important caveat remains:
None of these agreements are currently legally binding Power Purchase Agreements. They are framework agreements and memorandums of understanding rather than finalized commercial contracts.
Negative Developments
Not everything was positive.
Q2 EPS: –$0.28, versus consensus expectations of –$0.16
Operating cash burn guidance increased from $80–100 million to $120–150 million
Approximately $1.9 billion raised through ATM share issuance in 2026, resulting in significant shareholder dilution.
Despite today's rally, the stock remains roughly 75% below its 52-week high of $193.84.
⚖️ Valuation
With an approximately $8 billion market capitalization and only $1.2 million of quarterly revenue, Oklo is still valued almost entirely on future expectations.
The investment case assumes several major milestones are achieved simultaneously:
Aurora-INL enters commercial service in 2028.
Regulatory approvals proceed without major delays.
Meta, Switch, and other customers convert framework agreements into binding PPAs.
HALEU fuel becomes commercially available in sufficient quantities.
Wall Street's average price target stands near $84.20, implying roughly 71% upside from today's price.
However, analyst estimates range from $14 to $130, highlighting the exceptionally wide range of possible outcomes rather than a strong consensus.
💵 Dividends
Oklo does not pay dividends and is unlikely to initiate one for many years.
The company remains a capital-intensive growth business focused entirely on funding expansion.
⚠️ Top Three Risks
1. Shareholder Dilution
The company raised approximately $1.9 billion through ATM offerings during 2026.
With an ~$8 billion market cap, this represents substantial dilution.
If current cash burn persists, additional equity issuance remains a meaningful risk.
2. Customer Agreements Are Not Yet Binding
Meta, Switch, and other announced customers have signed framework agreements rather than legally binding PPAs.
If these agreements fail to convert into long-term contracts, a significant portion of the current AI power narrative could quickly disappear.
3. Regulatory Risk
Aurora-INL has completed only two of five required regulatory milestones.
Any meaningful delay in licensing or construction could push commercial operations back by one or two years, materially changing the company's valuation.
📈 Technical Analysis
On the weekly timeframe, OKLO is forming a falling wedge, a pattern that is often considered bullish when confirmed by a breakout.
The stock has also partially filled its previous gap and is currently testing both the 100-week and 200-week Simple Moving Averages, creating a strong confluence support zone.
This week closed with a powerful bullish candle accompanied by elevated trading volume, suggesting renewed institutional interest following the latest fundamental developments.
Momentum indicators are also beginning to improve:
RSI is currently around 45, indicating that the recent correction may be approaching its end while still leaving room for further upside.
ADX is starting to turn higher, suggesting that a new trend may be developing after a period of weakening momentum.
Price Targets
Target 1: $115.50
Target 2: $195.50
Invalidation
The bullish thesis would be invalidated by a confirmed weekly close below the 200-week SMA or below the gap support, which would indicate that buyers have lost control of the current support zone.
🎯 Conclusion
Today marks an important milestone for Oklo.
A functioning reactor, the company's first real revenue, a $3 billion liquidity position, and visible progress toward Aurora-INL all represent tangible execution rather than another presentation about future ambitions.
That said, the stock still demands near-perfect execution. An $8 billion valuation supported by only $1.2 million in quarterly revenue leaves little room for mistakes. Regulatory approvals, customer agreements, HALEU fuel availability, and project execution all need to align for today's valuation to be fully justified.
OKLO has taken a meaningful step from storytelling to execution—but at its current valuation, the market is already pricing in a great deal of future success.  Long
Long
 Long
Long
 Short
Short
CRDO Bulls Are Back? | Critical Resistance & Breakout Setup| CRDO Technical Analysis
👋 Hello TradingView Community!
Hello everyone and welcome back! 🌱📊
I hope you're having a great trading session and, most importantly, managing your risk properly. 🙏
Today we're taking a look at Credo Technology (CRDO), a technology company operating in the connectivity and data infrastructure space. Its exposure to long-term trends such as AI, data centers, high-speed networking and increasing data transmission demand makes it an interesting stock to watch. 🤖⚡️
💡 Fundamental Perspective
The U.S. stock market has historically been one of the major wealth-building markets over the long term. However, investing in individual technology stocks always comes with volatility and significant risk. 📈⚠️
Companies involved in the AI, Data Center, Networking and High-Speed Connectivity ecosystem have attracted substantial market attention.
At the same time, high valuations and elevated market expectations can create significant corrections when expectations are not met.
Therefore, for growth-oriented technology stocks, combining a long-term perspective with proper risk management and technical confirmation is extremely important. 🧠💰
📊 Technical Analysis – CRDO
From a technical perspective, the broader structure continues to show a strong and relatively stable bullish trend. 🟢📈
After a significant upside move, price entered a period of consolidation and correction, trading inside the range highlighted on the chart.
However, the important point is that after this corrective phase, buyers appear to be returning and price is once again pushing toward the upper resistance area. 🔥
At the moment, CRDO is approaching a major decision zone.
🚀 Bullish Scenario
If price can hold the current area and the recent move does not turn into a fake breakout, the probability of another bullish leg increases.
🎯 The key confirmation for the bullish scenario would be a breakout and solid confirmation above the marked resistance zone.
If that breakout is confirmed, the next bullish wave could potentially push price toward higher levels.
However, I would personally prefer to wait for confirmation of the breakout and observe price action afterward, rather than entering simply because price is approaching resistance. ⏳🎯
⚠️ Fake Breakout Scenario
There is also an important risk to consider.
If price fails to break through the resistance and the current move becomes a Fake Breakout, we could see a pullback toward the lower support levels. 📉
That is why waiting for confirmation is more important here than entering the market prematurely.
The market will always provide another opportunity — but capital lost through poor risk management is much harder to recover. 🛡️💵
🧭 Final Outlook
📈 Trend: Bullish
🟢 Bullish Trigger: Confirmation above resistance
🟡 Current Situation: Critical decision zone
🔴 Bearish Risk: Fake breakout and pullback
⏳ Approach: Wait for confirmation
The overall chart structure currently favors the buyers, but until the major resistance is clearly broken and confirmed, continuation of the bullish move cannot be considered certain.
In simple terms:
The structure is bullish, but we're still waiting for confirmation of the next major move. 📈👀
🗳️ TradingView Poll
What do you think happens next with CRDO? 🤔
🟢 Breakout & Continue Higher 🚀
🔴 Fake Breakout & Pullback 📉
🟡 More Consolidation Before the Next Move ⏳
Share your opinion in the comments! 👇💬
⚠️ Disclaimer
This analysis represents my personal view based on technical analysis, price structure and potential market scenarios. It is not financial advice and should not be considered a guaranteed buy or sell signal.
Trading and investing in stocks involve risk. Always conduct your own research (DYOR) and use proper risk and money management before making any investment decision. No technical setup is guaranteed. ⚠️📚
🏷️ Tags
CRDO CredoTechnology CRDOStock NASDAQ StockMarket USStocks TechStocks AIStocks ArtificialIntelligence DataCenter Semiconductors TechnicalAnalysis PriceAction Breakout Resistance Support SwingTrading Investing TradingView ForexCity SMCI Daily — Structure Before the MoveSMCI is one of those charts where the more I look at it, the less interested I am in trying to predict the next candle and the more interested I am in mapping the structure around it.
Right now, I don’t particularly love the setup.
That could change fairly quickly.
The larger daily structure still has SMCI trading beneath a long-running downward-sloping trendline, and that line has repeatedly mattered. I marked the major reactions with red arrows because each one helps establish that this is not a line I drew just because it looked convenient. Price has tested that general declining structure multiple times and repeatedly failed to establish itself above it.
That makes any future approach worth paying attention to.
The major horizontal levels
I have two larger horizontal reference areas marked at approximately $52 and $66.
The $52 area is especially important to me because it overlaps with the descending structure and has repeatedly acted as a meaningful decision area.
That creates a form of confluence I care about much more than any single line by itself.
A break of the diagonal trendline would be interesting.
A break of the trendline plus a successful reclaim of $52 would mean substantially more to me.
The $66 area sits above that as the next larger structural reference.
The first Area of Agreement
The first marked Area of Agreement developed during the earlier consolidation phase before price pushed higher.
This is important because it helps illustrate something I think gets overlooked in TA:
The best-looking move isn’t necessarily the best trade. Structure before the move is what can make it tradable.
That first violent spike on the left side of the chart was impressive, but catching something like that cleanly either direction would have required a tremendous amount of anticipation.
The later move was different.
After SMCI had already developed recognizable structure, price pushed sharply higher into the declining trendline and the broader resistance area.
That gave traders something much more useful: context.
Instead of guessing where a vertical move might stop, there was an established structural area where rejection actually meant something.
Price rejected the larger trend structure, dropped back down, and then began establishing a more defined range beneath it.
That range has now become its own reference structure.
To me, this is much more useful than simply labeling the entire region as chop.
It gives us a defined area where price has repeatedly found acceptance and where future expansion could begin.
The $21 level
The lower horizontal area around $21 is the clearest major support reference on this chart.
We’ve already seen an attempted break below that area get stopped and reversed.
I marked that because a failed breakdown at a major level can be just as informative as a successful breakout.
That said, I would not assume $21 automatically holds forever.
The more recent test did not actually reach the level, which is why I specifically labeled it “No Test.”
That distinction matters to me.
Close is not the same thing as tested.
What I think could happen next
The green dotted path is not a prediction.
It is one possible structural development I can imagine from here.
If SMCI eventually works its way back toward the descending trendline, I would not be surprised to see multiple attempts before any meaningful breakout.
That area carries too much prior history for me to assume price simply slices through it on the first try.
A rejection followed by consolidation, another test, and eventual breakout would make structural sense.
So would another failure.
That is why I am not particularly excited about the setup at approximately $31 right now.
It is sitting between more meaningful decision areas.
Bullish scenario
A bullish development would begin with SMCI continuing to build above the lower structure and eventually pressing toward the descending trendline.
A break above the diagonal would get my attention.
A reclaim and hold above $52 would get considerably more of it.
From there, $66 becomes the next major structural area I would watch.
Neutral scenario
SMCI may simply remain trapped inside this broader structure.
There is plenty of room for price to continue rotating between the lower support region and the overhead resistance without establishing a meaningful longer-term trend.
That is probably the scenario I am most interested in respecting until price proves otherwise.
Bearish scenario
Failure of the current structure brings the lower portion of the range back into focus.
A proper retest of $21 would be important.
A clean breakdown and acceptance below it would materially change the chart and invalidate much of the constructive scenario shown here.
What I’m watching
Right now I am less interested in choosing a direction than I am in watching how price behaves as it approaches these established structures.
The chart already gives me the reference points.
Now price has to tell me which ones actually matter next.
That is the value of mapping this beforehand.
Not predicting every move.
Just making sure the next major move does not arrive without context.  Long
Long
 Long
Long

 Education

 Long
Long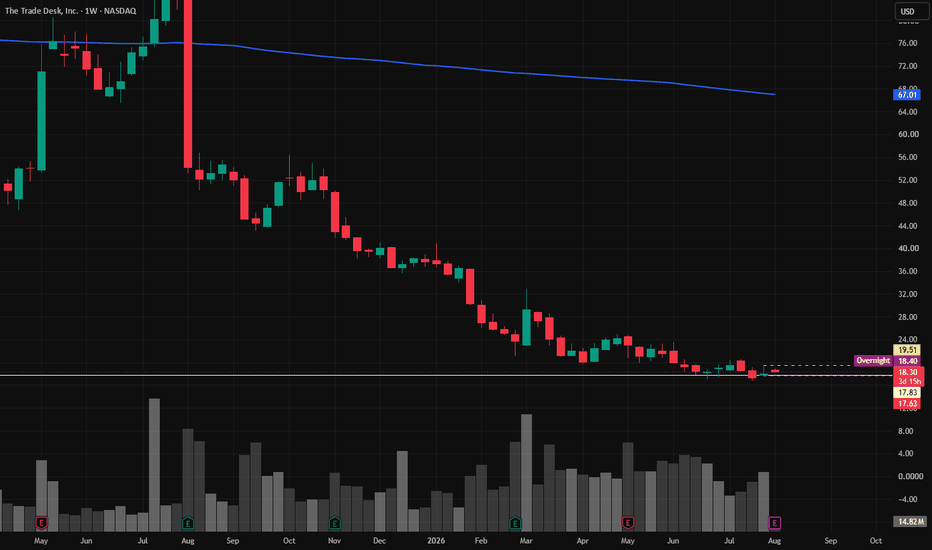
 Long
Long
ASML: Local Bull-Flag-Formation, Important Levels to Watch!Hello Community,
welcome to my new analysis of ASML from a 4-hour timeframe perspective. In the past, I have spotted interesting setups in the stock market that could become profitable trading opportunities in the near future. One of them is ASML. The stock is still trading in an uptrend that has not reversed yet, showing the potential for a long setup when the bullish momentum continues.
When looking at my chart, we can see how ASML trades within this prolonged ascending trend channel. ASML has strong support within the lower boundary, which it has bounced off already several times in the past. Now it continued to form this trend-following bull-flag-formation. Within this formation, it also already completed the wave count, fulfilling all features of a bullish breakout and continuation to the upside.
Once the breakout emerges, as seen in my chart, with a bounce above the upper boundary, this will determine the continuation to the upside. It will activate the target zone seen in my chart. The bullish crossover condition with the 50-EMA being above the 100-EMA also still holds. The upcoming times will determine the final bullish setup with prolonged bullish expansions. An aggressive entry is to enter immediately. A conservative entry is to wait for the breakout setup before entering.
In this manner, thank you a lot for watching!
The support is highly appreciated.
VP  Short
Short
 Long
Long

 Long
Long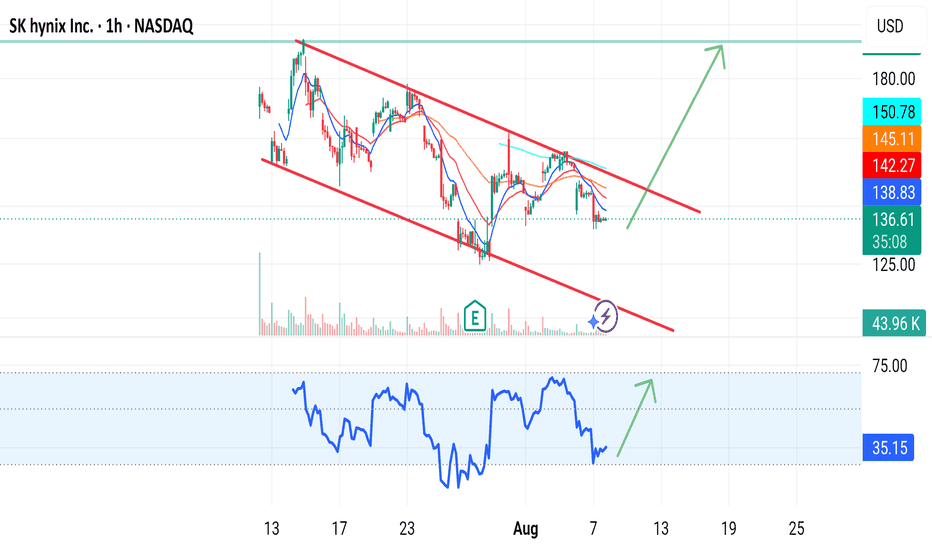
PLTR: Stock Finally Breaks Above The Major Trend ResistancePalantir Technologies (PLTR) stock skyrocketed roughly 29% to over $162 per share following an otherworldly second quarter earnings report. The massive rally was driven by a 149% surge in commercial revenue and a 90% jump in US government revenue, fueled by exploding global demand for sovereign AI tools.
Technical Insights:
PLTR is set on a long term descending channel, trending on a structural movement of lower lows and lower highs. The stock has been on this bearish pathway, for a couple of months now, staring from last year, in respect to the framework. Price will make a little retest, between $150-$157, before bullish continuation.
Key Points:
More buy confirmation at this areas, activates a another position, eyeing $185, as next possible bullish.
Thanks for reading.
 Long
Long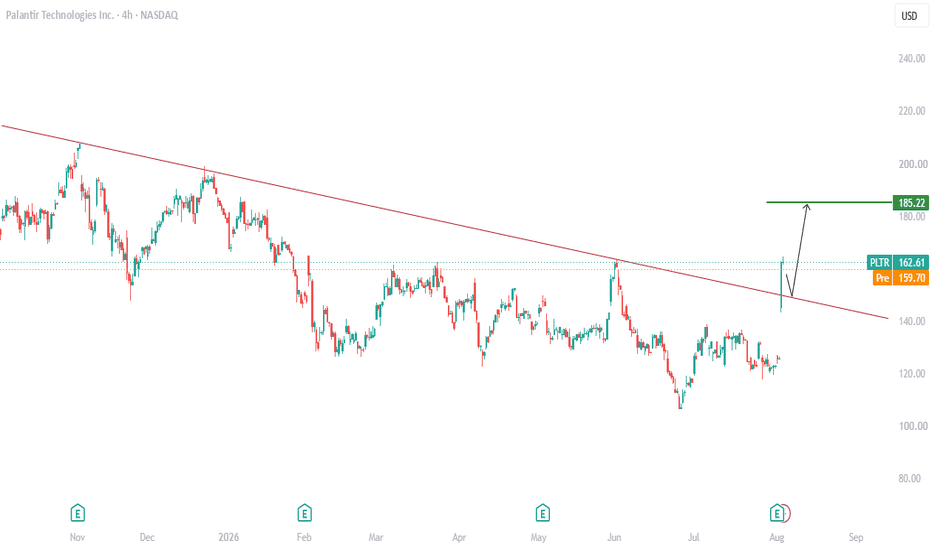
 Long
Long
 Long
Long
 Short
Short
Long